Matlab Code for Image Retrieval
₹3,000.00
Huge Price Drop : 50% Discount
Source Code + Demo Video
100 in stock
Description
Introduction and Background of Image retrieval
Image retrieval techniques are useful in many image-processing applications. Content-based image retrieval systems work with whole images and searching is based on comparison of the query. General techniques for image retrieval are color, texture and shape. These techniques are applied to get an image from the image database. They are not concerned with the various resolutions of the images, size and spatial color distribution. Hence all these methods are not appropriate to the art image retrieval. Moreover shape based retrievals are useful only in the limited domain. The content and metadata based system gives images using an effective image retrieval technique. Many other image retrieval systems use global features like color, shape and texture. But the prior results say there are too many false positives while using those global features to search for similar images. Hence we give the new view of image retrieval system using both content and metadata
Demonstration Video
Background
The use of images in human communication is hardly new – our cave-dwelling ancestors painted pictures on the walls of their caves, and the use of maps and building plans to convey information almost certainly dates back to pre-Roman times. But the twentieth century has witnessed unparalleled growth in the number, availability and importance of images in all walks of life. Images now play a crucial role in fields as diverse as medicine, journalism, advertising, design, education and entertainment. Technology, in the form of inventions such as photography and television, has played a major role in facilitating the capture and communication of image data. But the real engine of the imaging revolution has been the computer, bringing with it a range of techniques for digital image capture, processing, storage and transmission which would surely have startled even pioneers like John Logie Baird. The involvement of computers in imaging can be dated back to 1965, with Ivan Sutherland’s Sketchpad project, which demonstrated the feasibility of computerized creation, manipulation and storage of images, though the high cost of hardware limited their use until the mid-1980s. Once computerized imaging became affordable, it soon penetrated into areas traditionally depending heavily on images for communication, such as engineering, architecture and medicine. Photograph libraries, art galleries and museums, too, began to see the advantages of making their collections available in electronic form. The creation of the World-Wide Web in the early 1990s, enabling users to access data in a variety of media from anywhere on the planet, has provided a further massive stimulus to the exploitation of digital images. The number of images available on the Web was recently estimated to be between 10 and 30 million figure in which some observers consider to be a significant underestimate.
The Need For Image Data Management
The process of digitization does not in itself make image collections easier to manage. Some form of cataloguing and indexing is still necessary – the only difference being that much of the required information can now potentially be derived automatically from the images themselves. The extent to which this potential is currently being realized is discussed below.
The need for efficient storage and retrieval of images recognized by managers of large image collections such as picture libraries and design archives for many years – was reinforced by a workshop sponsored by the USA’s National Science Foundation in 1992. After examining the issues involved in managing visual information in some depth, the participants concluded that images were indeed likely to play an increasingly important role in electronically- mediated communication. However, significant research advances, involving collaboration between a numbers of disciplines, would be needed before image providers could take full advantage of the opportunities offered. They identified a number of critical areas where research was needed, including data representation, feature extractions and indexing, image query matching and user interfacing. One of the main problems they highlighted was the difficulty of locating a desired image in a large and varied collection. While it is perfectly feasible to identify a desired image from a small collection simply by browsing, more effective techniques are needed with collections containing thousands of items. Journalists requesting photographs of a particular type of event, designers looking for materials with a particular color or texture, and engineers looking for drawings of a particular type of part, all need some form of access by image content. The existence and continuing use of detailed classification schemes such as ICONCLASS for art images, and the Opitz code for machined parts, reinforces this message.
Color Feature Based Retrieval
Several methods for retrieving images on the basis of color similarity have been described in the literature, but most are variations on the same basic idea. Each image added to the collection is analyzed to compute a color histogram, which shows the proportion of pixels of each color within the image. The color histogram for each image is then stored in the database. At search time, the user can either specify the desired proportion of each color (75% olive green and 25% red, for example), or submit an example image from which a color histogram is calculated. Either way, the matching process then retrieves those images whose color histograms match those of the query most closely. The matching technique most commonly used, histogram intersection, was first developed . Variants of this technique are now used in a high proportion of current CBIR systems. Methods of improving on Swain and Ballard’s original technique include the use of cumulative color histograms , combining histogram intersection with some element of spatial matching, and the use of region-based color querying. The results from some of these systems can look quite impressive.
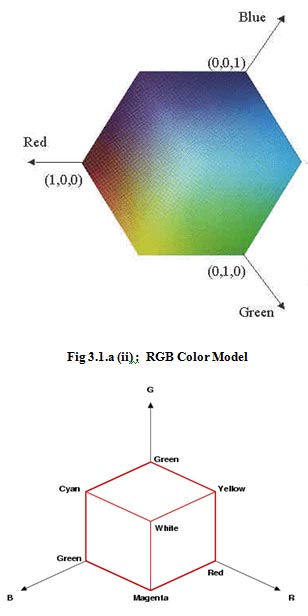
RGB color model
The RGB color model is composed of the primary colors Red, Green, and Blue. This system defines the color model that is used in most color CRT monitors and color raster graphics. They are considered the “additive primaries” since the colors are added together to produce the desired color. The RGB model uses the cartesian coordinate system. Notice the diagonal from (0,0,0) black to (1,1,1) white which represents the grey-scale. Figure 3.1.a (ii) view of the RGB Color Model looking down from “White” to origin.
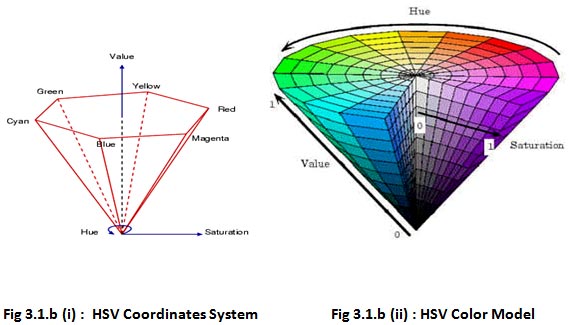
HSV Color Model
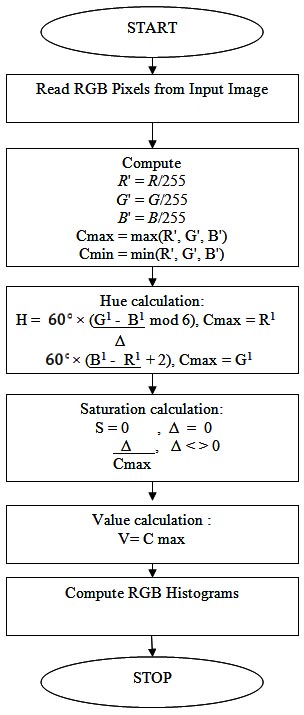
The HSV stands for the Hue, Saturation and Value. The coordinate system is a hexacone in Figure 3.1.b (a). And Figure 3.1.b (ii) a view of the HSV color model. The Value represents intensity of a Color, which is decoupled from the color information in the represented image. The hue and saturation components are intimately related to the way human eye perceives color resulting in image processing algorithms with physiological basis.
As hue varies from 0 to 1.0, the corresponding colors vary from red, through yellow, green, cyan, blue, and magenta, back to red, so that there are actually red values both at 0 and 1.0. As saturation varies from 0 to 1.0, the corresponding colors (hues) vary from unsaturated (shades of gray) to fully saturated (no white component). As value, or brightness, varies from 0 to 1.0, the corresponding colors become increasingly brighter.
Color Conversion
In order to use a good color space for a specific application, color conversion is needed between color spaces. The good color space for image retrieval system should preserve the perceived color differences. In other words, the numerical Euclidean difference should approximate the human perceived difference.
RGB to HSV Conversion
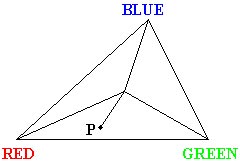
In Figure 3.1.c (ii), the obtainable HSV colors lie within a triangle whose vertices are defined by the three primary colors in RGB space:
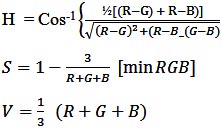
The hue of the point P is the measured angle between the line connecting P to the triangle center and line connecting RED point to the triangle center.The saturation of the point P is the distance between P and triangle center.The value (intensity) of the point P is represented as height on a line perpendicular to the triangle and passing through its center. The grayscalepoints are situated onto the same line. And the conversion formula is as follows :
Color Feature Extraction and Retrieval
HSV to RGB Conversion
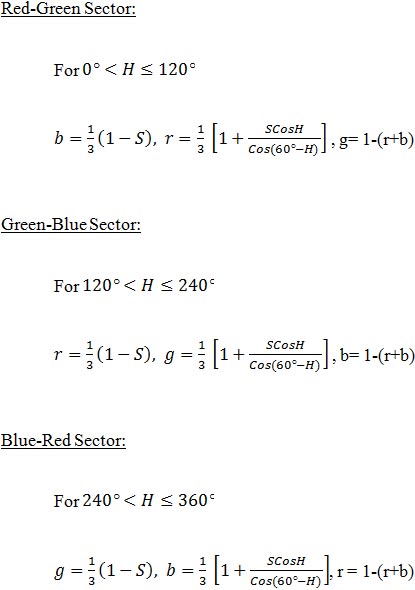
Conversion from HSV space to RGB space is more complex and given to the nature of the hue information, we will have a different formula for each sector of the color triangle.
Red-Green Sector:
HISTOGRAM – BASED IMAGE SEARCH
The color histogram for an image is constructed by counting the number of pixels of each color. Retrieval from image databases using color histograms has been investigated.
In these studies the developments of the extraction algorithms follow a similar progression:
- selection of a color space,
- quantization of the color space,
- computation of histograms,
- derivation of the histogram distance function,
- identification of indexing shortcuts.
Each of these steps may be crucial towards developing a successful algorithm. There are several difficulties with histogram based retrieval. The first of these is the high dimensionality of the color histograms. Even with drastic quantization of the color space, the image histogram feature spaces can occupy over 100 dimensions in real valued space. This high dimensionality ensures that methods of feature reduction, pre-filtering and hierarchical indexing must be implemented. The large dimensionality also increases the complexity and computation of the distance function. It particularly complicates ‘cross’ distance functions that include the perceptual distance between histogram bins [1].
Color Histogram Definition
An image histogram refers to the probability mass function of the image intensities. This is extended for color images to capture the joint probabilities of the intensities of the three color channels. More formally, the color histogram is defined by,
hA,B,C (a,b,c) – N.Prob(A=a, B=b, C-c)
where A , B and C represent the three color channels (R,G,B or H,S,V) and N is the number of pixels in the image. Computationally, the color histogram is formed by discretizing the colors within an image and counting the number of pixels of each color.
Since the typical computer represents color images with up to 224 colors, this process generally requires substantial quantization of the color space. The main issues regarding the use of color histograms for indexing involve the choice of color space and quantization of the color space. When a perceptually uniform color space is chosen uniform quantization may be appropriate. If a non-uniform color space is chosen, then non-uniform quantization may be needed. Often practical considerations, such as to be compatible with the workstation display, encourage the selections of uniform quantization and RGB color space. The color histogram can be thought of as a set of vectors. For gray-scale images these are two dimensional vectors. One dimension gives the value of the gray-level and the other the count of pixels at the gray-level. For color images the color histograms are composed of 4-D vectors. This makes color histograms very difficult to visualize. There are several lossy approaches for viewing color histograms, one of the easiest is to view separately the histograms of the color channels. This type of visualization does illustrate some of the salient features of the color histogram .
Color Uniformity
The RGB color space is far from being perceptually uniform. To obtain a good color representation of the image by uniformly sampling the RGB space it is necessary to select the quantization step sizes to be fine enough such that distinct colors are not assigned to the same bin. The drawback is that oversampling at the same time produces a larger set of colors than may be needed. The increase in the number of bins in the histogram impacts performance of database retrieval. Large sized histograms become computationally unwieldy, especially when distance functions are computed for many items in the database. Furthermore, as we shall see in the next section, to have finer but not perceptually uniform sampling of colors negatively impacts retrieval effectiveness.
However, the HSV color space mentioned earlier offers improved perceptual uniformity. It represents with equal emphasis the three color variants that characterize color: Hue, Saturation and Value (Intensity). This separation is attractive because color image processing performed independently on the color channels does not introduce false colors. Furthermore, it is easier to compensate for many artifacts and color distortions. For example, lighting and shading artifacts are typically be isolated to the lightness channel. But this color space is often inconvenient due to the non-linearity in forward and reverse transformation with RGB space
Color Histogram Discrimination
There are several distance formulas for measuring the similarity of color histograms. In general, the techniques for comparing probability distributions, such as the kolmogoroff-smirnov test are not appropriate for color histograms. This is because visual perception determines similarity rather than closeness of the probability distributions. Essentially, the color distance formulas arrive at a measure of similarity between images based on the perception of color content. Three distance formulas that have been used for image retrieval including histogram euclidean distance, histogram intersection and histogram quadratic (cross) distance [2, 3].
Histogram Quadratic Distance
Let ‘h’ and ‘g’ represent two color histograms. The euclidean distance between the color histograms ‘h’ and ‘g’ can be computed as:
d2 (h,g) = ∑ ∑ ∑ (h(a,b,c)-g(a,b,c))2
In this distance formula, there is only comparison between the identical bins in the respective histograms. Two different bins may represent perceptually similar colors but are not compared cross-wise. All bins contribute equally to the distance.
Histogram Intersection Distance
The color Histogram intersection was proposed for color image retrieval in [4]. Colors not present in the user’s query image do not contribute to the intersection distance. This reduces the contribution of background colors. The sum is normalized by the histogram with fewest samples. The color Histogram quadratic distance was used by the QBIC system introduced in [2]. The cross distance formula is given by:
d(h,g) = (h-g)t A(h-g)
The cross distance formula considers the cross-correlation between histogram bins based on the perceptual similarity of the colors represented by the bins. And the set of all cross-correlation values are represented by a matrix A, which is called a similarity matrix. And a (i,j)th element in the similarity matrix A is given by :
for RGB space,
where dij is the distance between the color i and j in the RGB space. In the case that quantization of the color space is not perceptually uniform the cross term contributes to the perceptual distance between color bins.
For HSV space it is given in [5] by:
Which corresponds to the proximity in the HSV color space
Results & Analysis
Thus in this phase we took a literature survey for various CBIR methods. The semantic gap between low level features and high level concept more and the retrieved output consisted lot of errors. Hence we wish to propose a new algorithm that retrieves the images based on color, texture and fuzzy features. Then integrated results will be outputted to the user. Hence the retrieval accuracy will be high and less interaction is needed. In this phase we propose two different algorithms, colour and texture based.
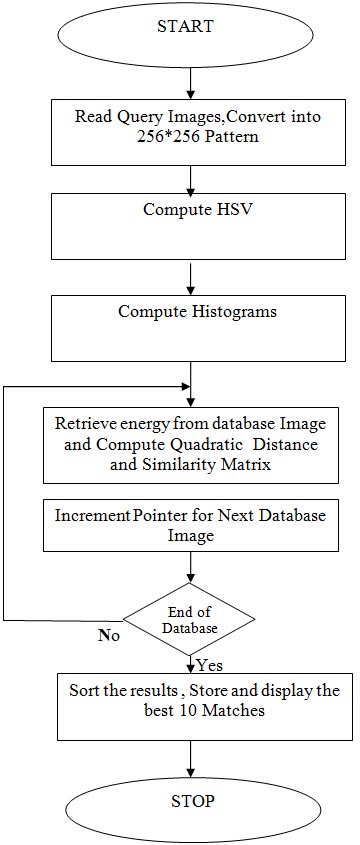
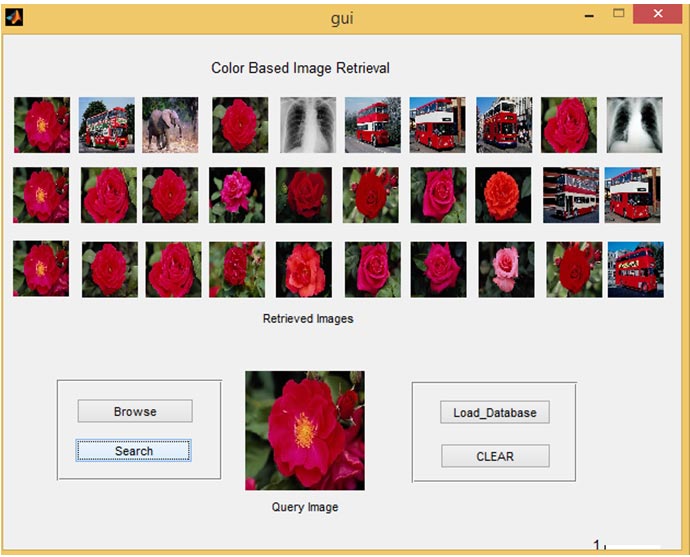
The similarity measure by a given query image involves searching the database for similar coefficients. Euclidean and quadratic distance is suitable and effective method which is widely used in image retrieval area. The retrieval results are a list of medical images ranked by their similarities measure with the query image.
The images in the database are ranked acscording to their distance d to the query image in ascending orders, and then the ranked images are retrieved. The computed distance is ranked according to closest similar; in addition, if the distance is less than a certain threshold set, the corresponding original images is close or match the query image. Precision P is defined as the ratio of the number of retrieved relevant images r to the total number of retrieved images n, i.e., P =r/n [1]. Precision measures the accuracy of the retrieval.
Recall is defined by R and is defined as the ratio of the number of retrieved relevant images r to the total number m of relevant images in the whole database, i.e.,R=r/m [1]. Recall measures the robustness of the retrieval.
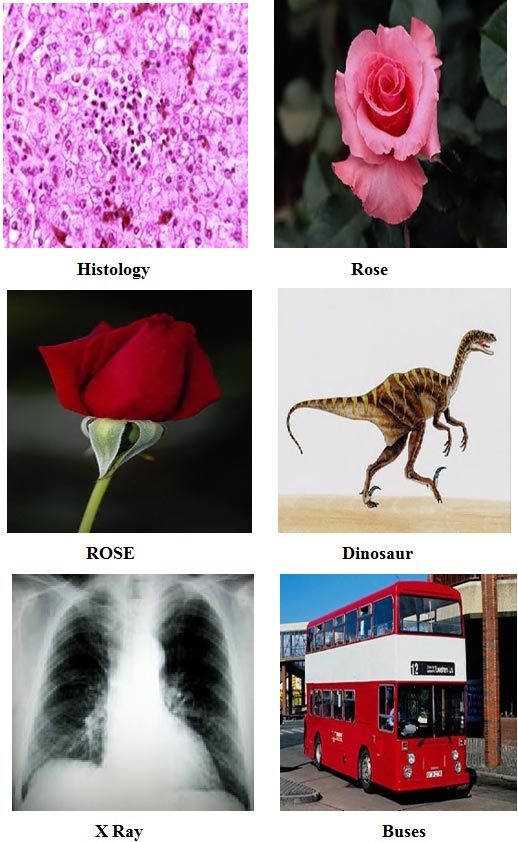
Database Images
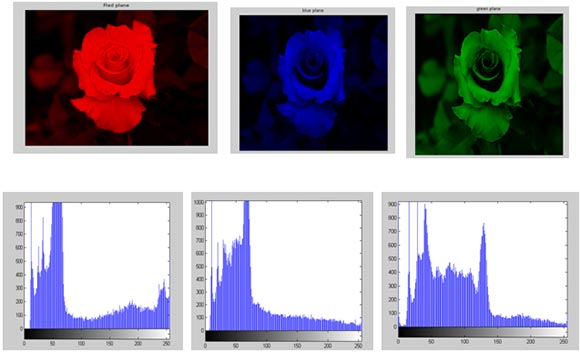
RGB Color Plane separation for Color Based Image Retrieval.
The below images shown RGB plane separation and its corresponding Histograms.
The Average Recall Rate (AVRR) is given by the equation
where the rank of any of the retrieved images is defined to be its position in the list of retrieved image is one of the relevant images in the database. The rank is defined to be zero otherwise. Nr is the number of relevant images in the database, and Q is the number of queries performed. Therefore AVRR is defined in equation .In our case, the number of images retrieved was 10, and Nr was less than 10.
AVRR = (Nr + 1 ) / 2
Matlab Code for Color Image Retrieval
Conclusion
In this project it has been analyzed that an color features of image content descriptor .The timing results for the integrated approach is less and accurate, this can be improved by integrating other spatial relationship.
Other References
[1] “Histology Image Retrieval in Optimized Multifeature Spaces” by Qianni Zhang and Ebroul Izquierdo, Senior Member of IEEE, published in IEEE Journal of Biomedical and Health Informatics , vol,17,No.1 , January 2013.
[2] “Color and texture feature-based image retrieval by using Hadamard matrix in discrete wavelet transform “ by Hassan Farsi, Sajad Mohamadzadeh , Published in IET Image Processing,January 2013.
[3] “Content-based texture image retrieval using fuzzy class membership” by Sudipta Mukhopadhyay, Pattern Recognition Letters of Elsevier journal , January 2013.
[4] “A performance evaluation of gradient field HOG descriptor for sketch based image retrieval”,by Rui Hu, John Collomosse, Computer vision and understanding of Elsevier journal, January 2013.
[5] “Fuzzy Shape Clustering for Image Retrieval” by G. Castellano, A.M. Fanelli, F. Paparella, M.A. Torsello, published in Pattern Recognition Letters of Elsevier journal , January 2012.
[6] “Content based image retrieval using Dual Tree complex Wavelet Transform” by Christina George Bab, D. Abraham Chandl , 2012 International Conference on Signal Processing, Image Processing and Pattern Recognition .
[7] “Content Based Image Retrieval using Discrete Wavelet Transform and Edge Histogram Descriptor” by Swati Agarwal, A. K. Verma , Preetvanti Singh, 2011 International Conference on Information Systems and Computer Networks .
[8] “A New Feature Set For Content Based Image Retrieval” , by M.Babu Rao, Ch.Kavitha , B.Prabhakara Rao, A.Govardhan, 2012 International Conference on Signal Processing, Image Processing and Pattern Recognition .
[9] “Combined texture and Shape Features for Content Based Image Retrieval” by M. Mary Helta Daisy, Dr.S. TamilSelvi , Js. GinuMol, 2012 International Conference on Circuits, Power and Computing Technologies.
[10] “Fusion of Colour, Shape and Texture Features for Content Based Image Retrieval” by Pratheep Anantharatnasamy, Kaavya Sriskandaraja, Vahissan Nandakumar and Sampath Deegalla, The 8th International Conference on Education (ICCSE 2011) April 26-28, 2012, Colombo,SriLanka.




Reviews
There are no reviews yet.